Overview
The Analytics product shows how an event is performing — searches, downloads, page visits, and engagement. It’s available on all plans and has two tabs: Overview and Analytics. Open it from an event’s product navigation: Analytics.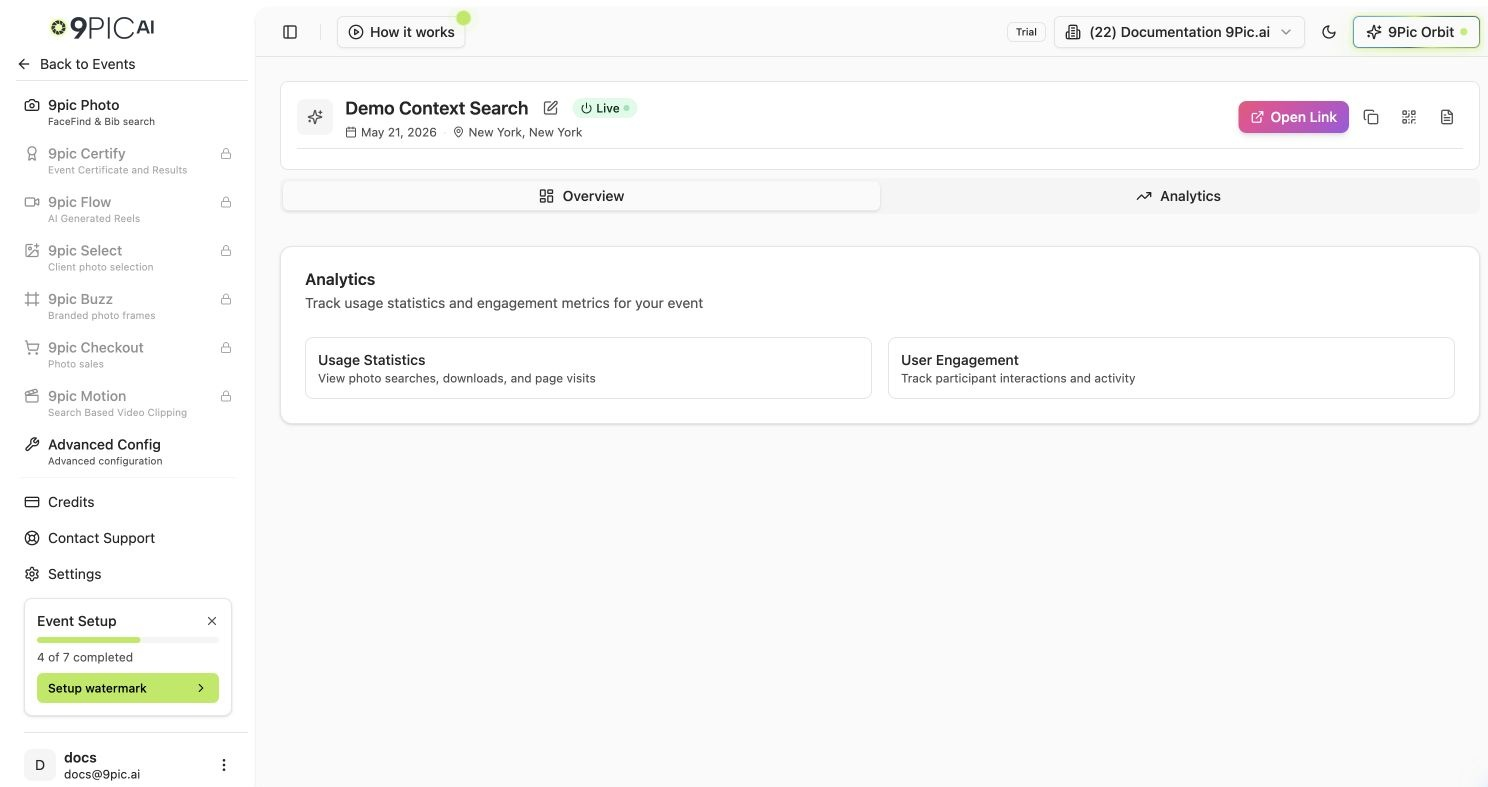
Overview Tab
A quick orientation with two summary cards:| Card | What it covers |
|---|---|
| Usage Statistics | Photo searches, downloads, and page visits |
| User Engagement | Participant interactions and activity |
Analytics Tab
The detailed view:- Usage statistics — the core engagement and usage numbers for the event.
- Page analytics — Google Analytics page-level metrics for the public event page.
Common Questions
There's no data yet.
There's no data yet.
Analytics populate after the event is published and participants start visiting and searching. Confirm the event is live and the link has been shared.
Do analytics update in real time?
Do analytics update in real time?
They update continuously as participants interact with the gallery, though small reporting delays are normal.
Can I export a report?
Can I export a report?
Email support@9pic.ai if you need a formal export for sponsors.
Next Steps
9Pic Photo overview
Publish the event so analytics start collecting.
Checkout Transactions
Revenue analytics for events that sell photos.